Description
The species tree reconstruction webserver consists of a series of phylogenetic tools for estimating species trees from phylogenomic data: 1) rooting gene trees with outgroup species, 2) estimating species trees from the rooted gene trees using STAR [1] , MP-EST 1.2 [2], NJst methods [3], 3) bootstrap analyses for the species tree reconstruction methods (STAR, MP-EST, and NJst). The input data are either rooted or unrooted gene trees. If the gene trees are unrooted, they will be converted to rooted trees using the outgroup species. The output is the estimate of the species tree. If the user chooses the bootstrap analysis, the bootstrap support values will appear on the estimate of the species tree. The species tree reconstruction methods are fundamental tools for the studies in evolutionary biology, conservation biology, epidemiology, and cancer genetics etc. The past few years have witnessed a fast expansion of species tree reconstruction methods, but installation and compilation of the programs for these methods become a real challenge for biologists and other users who attempt to use these tools to analyze their data. Moreover, the methods often require specific format of the input data, which may not be compatible with the data set in hand. This novel webserver for species tree reconstruction provides a user-friendly web interface for species tree analyses, where the users do not need to worry about installation, compilation, or the required format of the input data. The webserver also contains links to the source code of the species tree reconstruction methods, and the example files for implementing these tree reconstruction methods.
Citing Species Tree Webserver
Shaw, T., Z. Ruan, T. Glenn, and Liu, L. STRAW: Species TRee Analysis Web server. Nucleic Acids Research. 2013, doi: 10.1093/nar/gkt377
Species Tree Functions
1. STAR method estimates species tree from average ranks of gene coalescence events. The input gene trees must be bifurcating rooted trees (w/o branch lengths) in Newick format, for examples, the ML trees generated from PHYML, RAXML, or PHYLIP and rooted with the outgroup species. The STAR method allows missing taxa in some gene trees. Source Code: phybase
2. NJst method is similar to the STAR method but it is able to take in unrooted species trees. Species tree is estimated by the neighbor joining trees built from a distance matrix. See Liu et al Source Code: phybase
3. MP-EST method estimates species trees from a set of gene trees by maximizing a pseudo-likelihood function. The input gene trees must be bifurcating rooted trees (w/o branch lengths) in Newick format, for example, the ML trees generated from PHYML, RAXML, or PHYLIP and rooted with the outgroup species. The MP-EST method allows missing taxa in some gene trees. Source Code: MP-EST Source
4. Bootstrap method is implemented based on a multilocus bootstrap method by Seo et al.. The method resamples nucleotide within a loci as well as resampling the loci within the dataset.
5. Species, number of alleles, allele names Table Creator (SNA Table) is a tool we created for automatically creating the species Allele Table by parsing the loci names within the phylogentic tree.
6. Rerooting Tree is a tool for rerooting the tree based on the user selected loci name.
Example Input Tree File
--- * Non-Bootstrapped Input Tree File
Gene trees need to be placed in newick format. For each species could possess multiple gene locus or missing locus based on the available data.
Gene Tree Example 1
Gene Tree Example 2
Gene Tree Example 3
--- * Bootstrapped Input Tree File
For the bootstrapped gene trees, each bootstrapped gene tree should be of a separate file.
Note that the gene tree files should be one of the following filetype:
"*.boot", "*.bs", "*.nwk", "*.tre", "*.new", "*.txt", "*.phylip", "*.out"
Bootstrap Example
Example Species Allele Table File
When multiple alleles (or sequences) are sampled from some species, the user must provide a species-allele table to indicate which alleles belong to which species. For example, the following gene trees have taxa S1 - 6.
(((((S1:0.1,S2:0.1):0.1,S4:0.1):0.1,S3:0.1):0.1,S5:0.1):0.1,S6:0.2);
(((((S1:0.1,S2:0.1):0.1,S4:0.1):0.1,S5:0.1):0.1,S3:0.1):0.1,S6:0.2);
(((((S1:0.1,S2:0.1):0.1,S4:0.1):0.1,S3:0.1):0.1,S5:0.1):0.1,S6:0.2);
Suppose S1 and S2 were sampled from Human, S3 and S4 were sampled from Ape, S5 were sampled from Gorilla, and S6 was sampled from Chimpanzee. Then the species-allele table may be
User Input Area

The user need to upload a tre file or a zip file containing gene tree tre files to run our software. The user have the option of uploading a file or pasting the text as indicated by (1). Based on the selection made in (1) the user would click on Choose File for uploading a file or paste the newick trees into the text area.
For the species allele input, the user can optionally input a file containing the gene allele to species information or a text based on the selection made in (3). User can upload a file or paste the text at (4).
The user can select a bootstrap approach at (5). For bootstrapping, the user will need to concatenate all the gene trees into one folder and zip it up. Currently only zip files are accepted. The tree files must be rooted and the file names must end with *.tre *.tree *.txt or *.new *.newick.
After the desired selection, the user would click submit to run the species tree analysis at (6). An example is provided for the user after click 'example' (7)
Example Species Allele Table File
Suppose S1 and S2 were sampled from Human, S3 and S4 were sampled from Ape, S5 were sampled from Gorilla, and S6 was sampled from Chimpanzee. Then the species-allele table may be
Viewing the Results

The result from the species tree calculation is provided as the newick format as indicated by (1). The user can also have the option of downloading the species tree by right click on "output.tre" and save the file to their computer (2).

To help the user get a sense of the variation of tree structure differences between each gene tree to the species tree, the tree distance is calculated using phybase.

There is two option for visualizing the species tree. One is a circular tree (4) and the other is a rectangular tree (5). By Clicking on one of the two options would change the display for each of the trees.
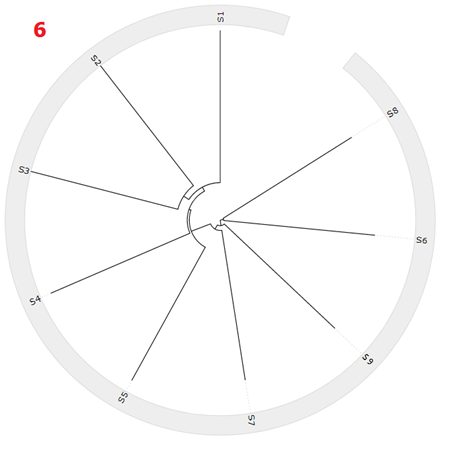
The circular tree is presents the tree in a radial form. Nodes located further out of the circle represents distance further away from the root. For each name on the phylogenetic tree, a circle highlight will appear to highlight the location of that node within the tree.

The rectangular tree is presents the tree in a rectangular form. Nodes located further right of the tree represents nodes further away from the root. For each name on the phylogenetic tree, a circle highlight will appear to highlight the location of that node within the tree.
Last Updated Date: April 23, 2013
The species tree reconstruction webserver consists of a series of phylogenetic tools for estimating species trees from phylogenomic data: 1) rooting gene trees with outgroup species, 2) estimating species trees from the rooted gene trees using STAR [1] , MP-EST 1.2 [2], NJst methods [3], 3) bootstrap analyses for the species tree reconstruction methods (STAR, MP-EST, and NJst). The input data are either rooted or unrooted gene trees. If the gene trees are unrooted, they will be converted to rooted trees using the outgroup species. The output is the estimate of the species tree. If the user chooses the bootstrap analysis, the bootstrap support values will appear on the estimate of the species tree. The species tree reconstruction methods are fundamental tools for the studies in evolutionary biology, conservation biology, epidemiology, and cancer genetics etc. The past few years have witnessed a fast expansion of species tree reconstruction methods, but installation and compilation of the programs for these methods become a real challenge for biologists and other users who attempt to use these tools to analyze their data. Moreover, the methods often require specific format of the input data, which may not be compatible with the data set in hand. This novel webserver for species tree reconstruction provides a user-friendly web interface for species tree analyses, where the users do not need to worry about installation, compilation, or the required format of the input data. The webserver also contains links to the source code of the species tree reconstruction methods, and the example files for implementing these tree reconstruction methods.
Citing Species Tree Webserver
Shaw, T., Z. Ruan, T. Glenn, and Liu, L. STRAW: Species TRee Analysis Web server. Nucleic Acids Research. 2013, doi: 10.1093/nar/gkt377
Species Tree Functions
1. STAR method estimates species tree from average ranks of gene coalescence events. The input gene trees must be bifurcating rooted trees (w/o branch lengths) in Newick format, for examples, the ML trees generated from PHYML, RAXML, or PHYLIP and rooted with the outgroup species. The STAR method allows missing taxa in some gene trees. Source Code: phybase
2. NJst method is similar to the STAR method but it is able to take in unrooted species trees. Species tree is estimated by the neighbor joining trees built from a distance matrix. See Liu et al Source Code: phybase
3. MP-EST method estimates species trees from a set of gene trees by maximizing a pseudo-likelihood function. The input gene trees must be bifurcating rooted trees (w/o branch lengths) in Newick format, for example, the ML trees generated from PHYML, RAXML, or PHYLIP and rooted with the outgroup species. The MP-EST method allows missing taxa in some gene trees. Source Code: MP-EST Source
4. Bootstrap method is implemented based on a multilocus bootstrap method by Seo et al.. The method resamples nucleotide within a loci as well as resampling the loci within the dataset.
5. Species, number of alleles, allele names Table Creator (SNA Table) is a tool we created for automatically creating the species Allele Table by parsing the loci names within the phylogentic tree.
6. Rerooting Tree is a tool for rerooting the tree based on the user selected loci name.
Example Input Tree File
--- * Non-Bootstrapped Input Tree File
Gene trees need to be placed in newick format. For each species could possess multiple gene locus or missing locus based on the available data.
Gene Tree Example 1
Gene Tree Example 2
Gene Tree Example 3
--- * Bootstrapped Input Tree File
For the bootstrapped gene trees, each bootstrapped gene tree should be of a separate file.
Note that the gene tree files should be one of the following filetype:
"*.boot", "*.bs", "*.nwk", "*.tre", "*.new", "*.txt", "*.phylip", "*.out"
Bootstrap Example
Example Species Allele Table File
When multiple alleles (or sequences) are sampled from some species, the user must provide a species-allele table to indicate which alleles belong to which species. For example, the following gene trees have taxa S1 - 6.
(((((S1:0.1,S2:0.1):0.1,S4:0.1):0.1,S5:0.1):0.1,S3:0.1):0.1,S6:0.2);
(((((S1:0.1,S2:0.1):0.1,S4:0.1):0.1,S3:0.1):0.1,S5:0.1):0.1,S6:0.2);
User Input Area
The user need to upload a tre file or a zip file containing gene tree tre files to run our software. The user have the option of uploading a file or pasting the text as indicated by (1). Based on the selection made in (1) the user would click on Choose File for uploading a file or paste the newick trees into the text area.
For the species allele input, the user can optionally input a file containing the gene allele to species information or a text based on the selection made in (3). User can upload a file or paste the text at (4).
The user can select a bootstrap approach at (5). For bootstrapping, the user will need to concatenate all the gene trees into one folder and zip it up. Currently only zip files are accepted. The tree files must be rooted and the file names must end with *.tre *.tree *.txt or *.new *.newick.
After the desired selection, the user would click submit to run the species tree analysis at (6). An example is provided for the user after click 'example' (7)
Example Species Allele Table File
Suppose S1 and S2 were sampled from Human, S3 and S4 were sampled from Ape, S5 were sampled from Gorilla, and S6 was sampled from Chimpanzee. Then the species-allele table may be
| H | 2 | S1 S2 |
| A | 2 | S3 S4 |
| G | 1 | S5 |
| C | 1 | S6 |
Viewing the Results
The result from the species tree calculation is provided as the newick format as indicated by (1). The user can also have the option of downloading the species tree by right click on "output.tre" and save the file to their computer (2).
To help the user get a sense of the variation of tree structure differences between each gene tree to the species tree, the tree distance is calculated using phybase.
There is two option for visualizing the species tree. One is a circular tree (4) and the other is a rectangular tree (5). By Clicking on one of the two options would change the display for each of the trees.
The circular tree is presents the tree in a radial form. Nodes located further out of the circle represents distance further away from the root. For each name on the phylogenetic tree, a circle highlight will appear to highlight the location of that node within the tree.
The rectangular tree is presents the tree in a rectangular form. Nodes located further right of the tree represents nodes further away from the root. For each name on the phylogenetic tree, a circle highlight will appear to highlight the location of that node within the tree.
Last Updated Date: April 23, 2013